Analyzing Asia’s earthquake burden:
from frequent shocks to catastrophic loss, 1990–2025
“It is the nature of the earth to shift. It is the nature of fragile things to break.”
Earthquakes are a global phenomenon, but their consequences are not distributed evenly around the world. Using the NOAA Global Significant Earthquake Database, the plots below examine the world’s, and especially Asia’s, earthquake burden from 1990 to 2025, tracing where major earthquakes occur, how deaths are concentrated in a handful of catastrophic events, and revealing the relationship between natural hazard and human vulnerability.
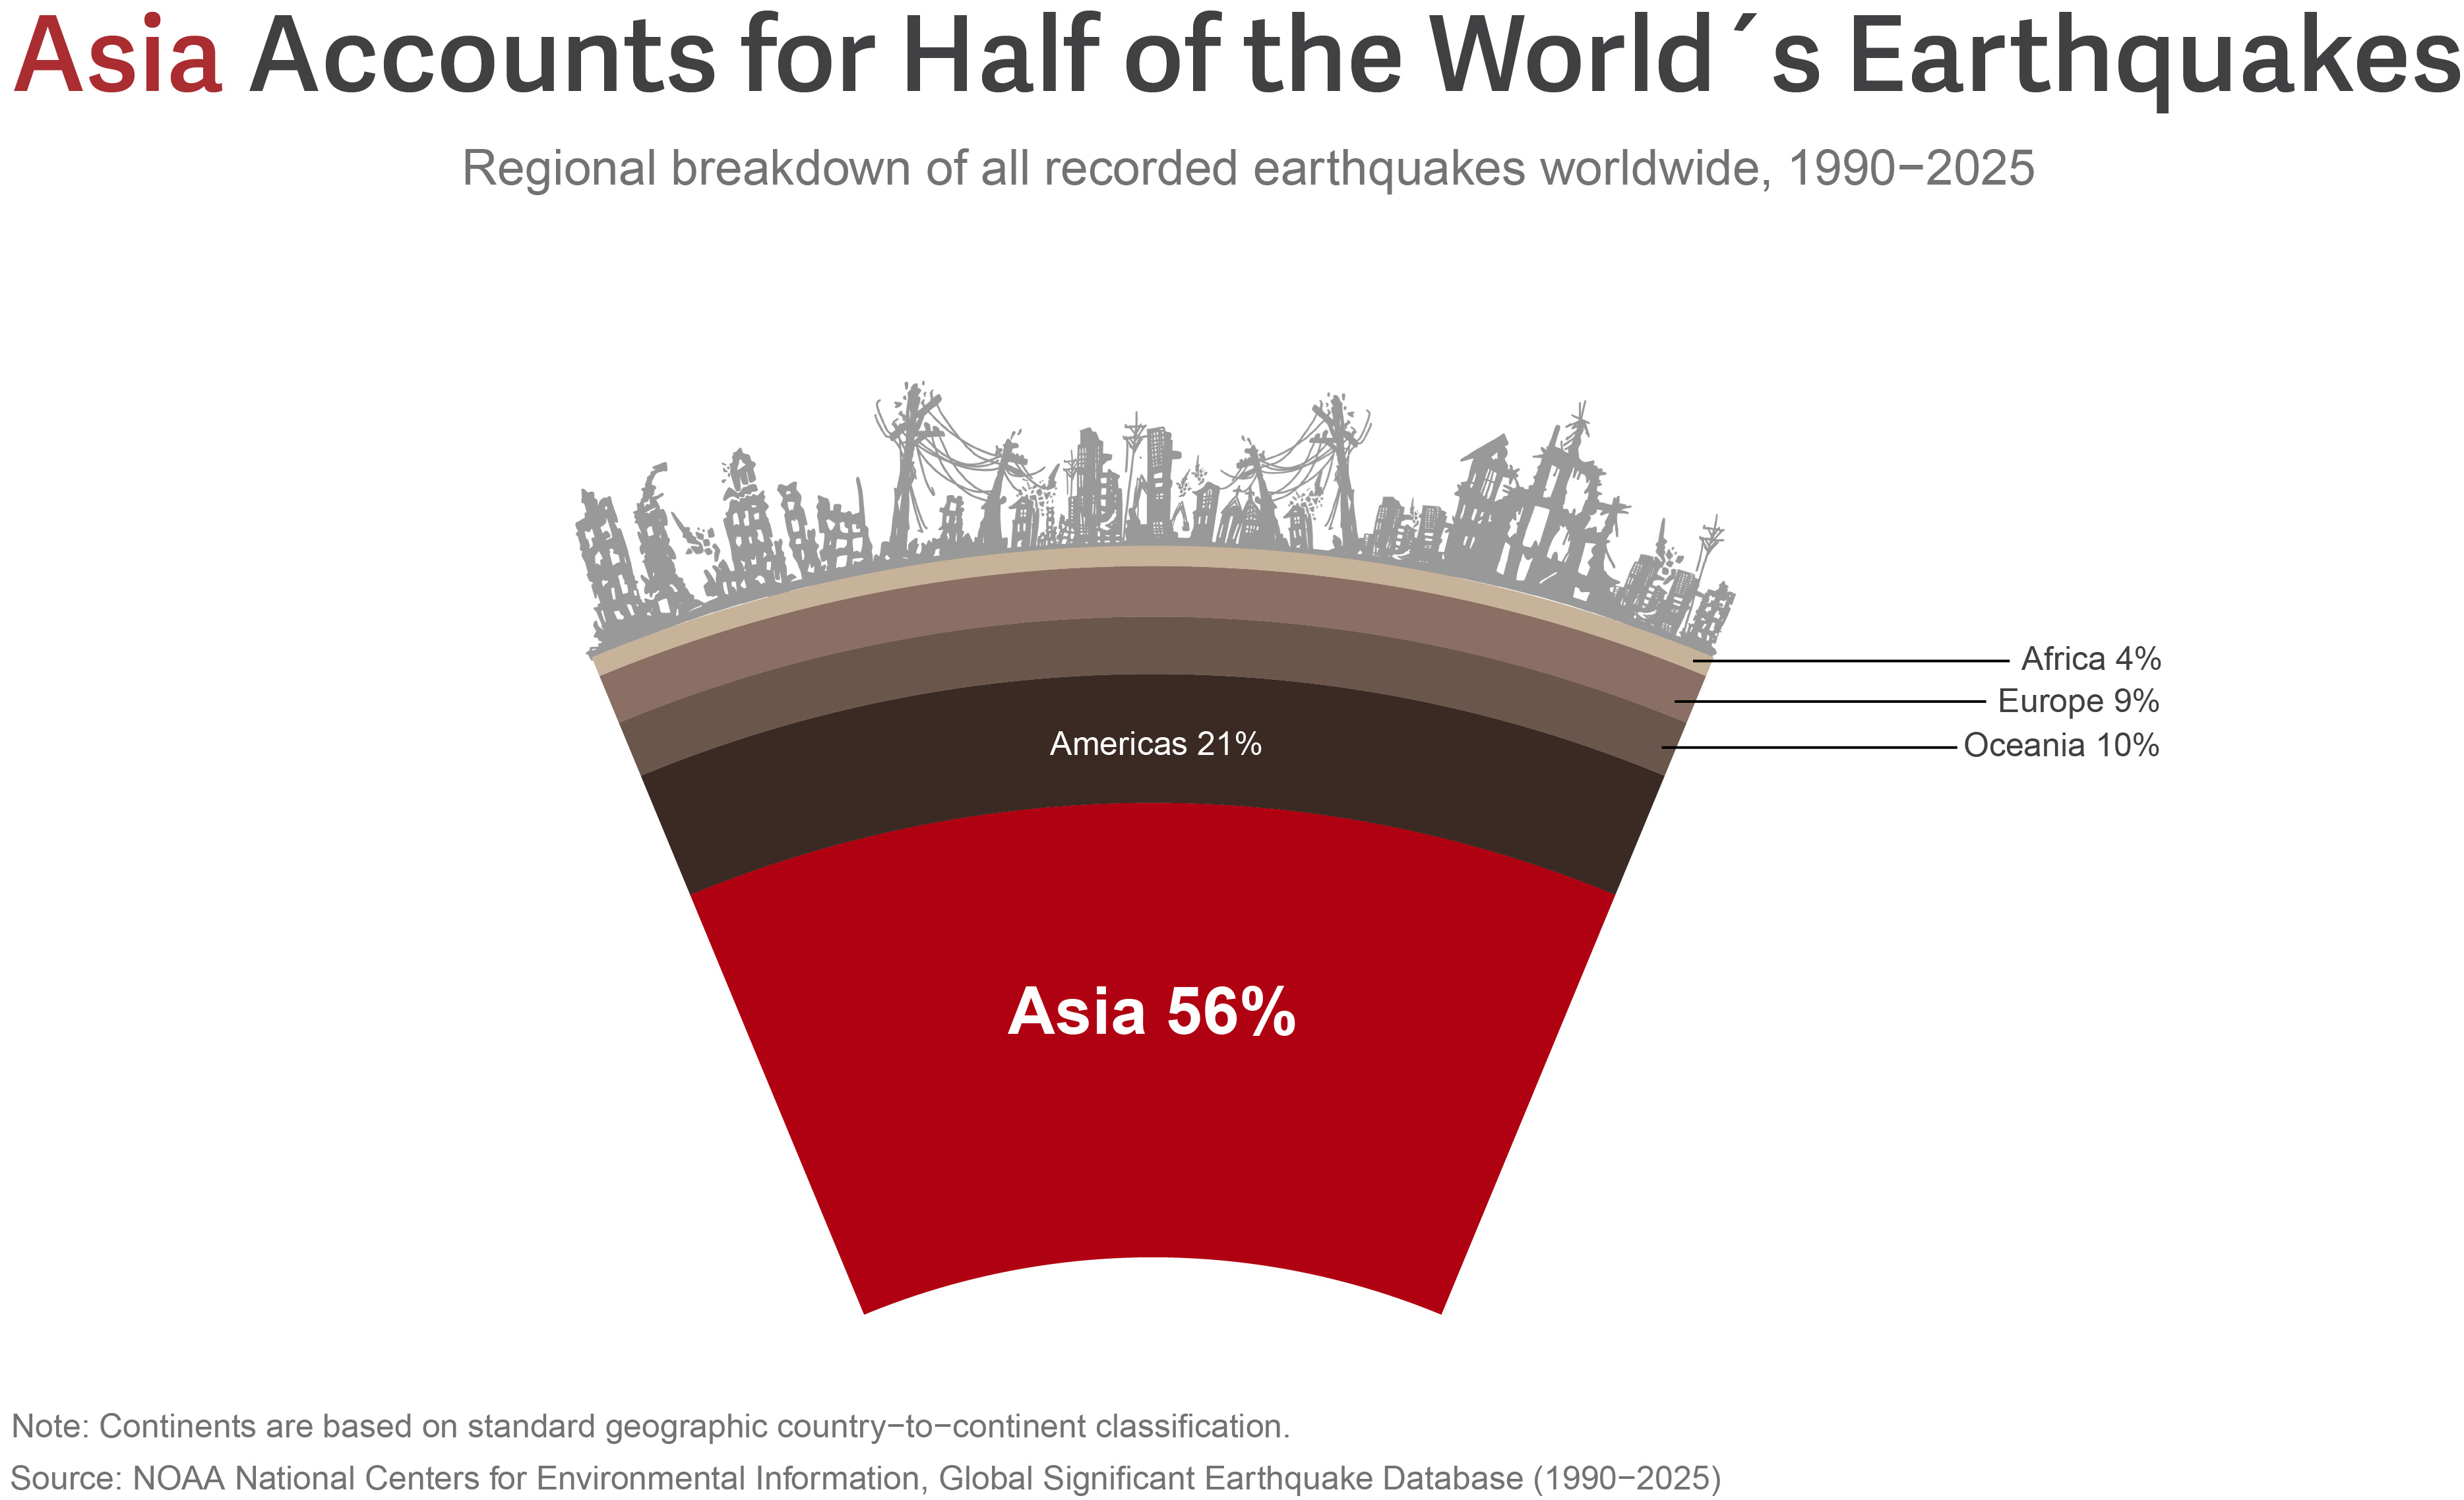
Let’s begin with a wider perspective of the story, and observe how the occurrence of earthquakes is distributed across regions from 1990 to 2025. Without any doubt, Asia stands out clearly: it accounts for the largest share of major earthquakes, representing 56% of all recorded events in this dataset and even exceeding the sum of all other regions combined. One likely reason is that much of Asia lies along major tectonic plate boundaries, including the circum-Pacific “Ring of Fire,” the most seismically active zone in the world, where plates collide, slide past one another, and subduct. This matters because it confirms that Asia is not only central to the world’s seismic activity, but also central to any conversation about earthquake risk and loss.
Yet Asia is far from uniform, as within this region, some areas experience many more events and much more serious human loss than others. These uneven distributions may indicate that there are local differences between each area, especially when a single region contains countries with very different geography, population density, infrastructure, and disaster preparedness. For that reason, it is necessary to move beyond the regional overview and look within Asia itself.
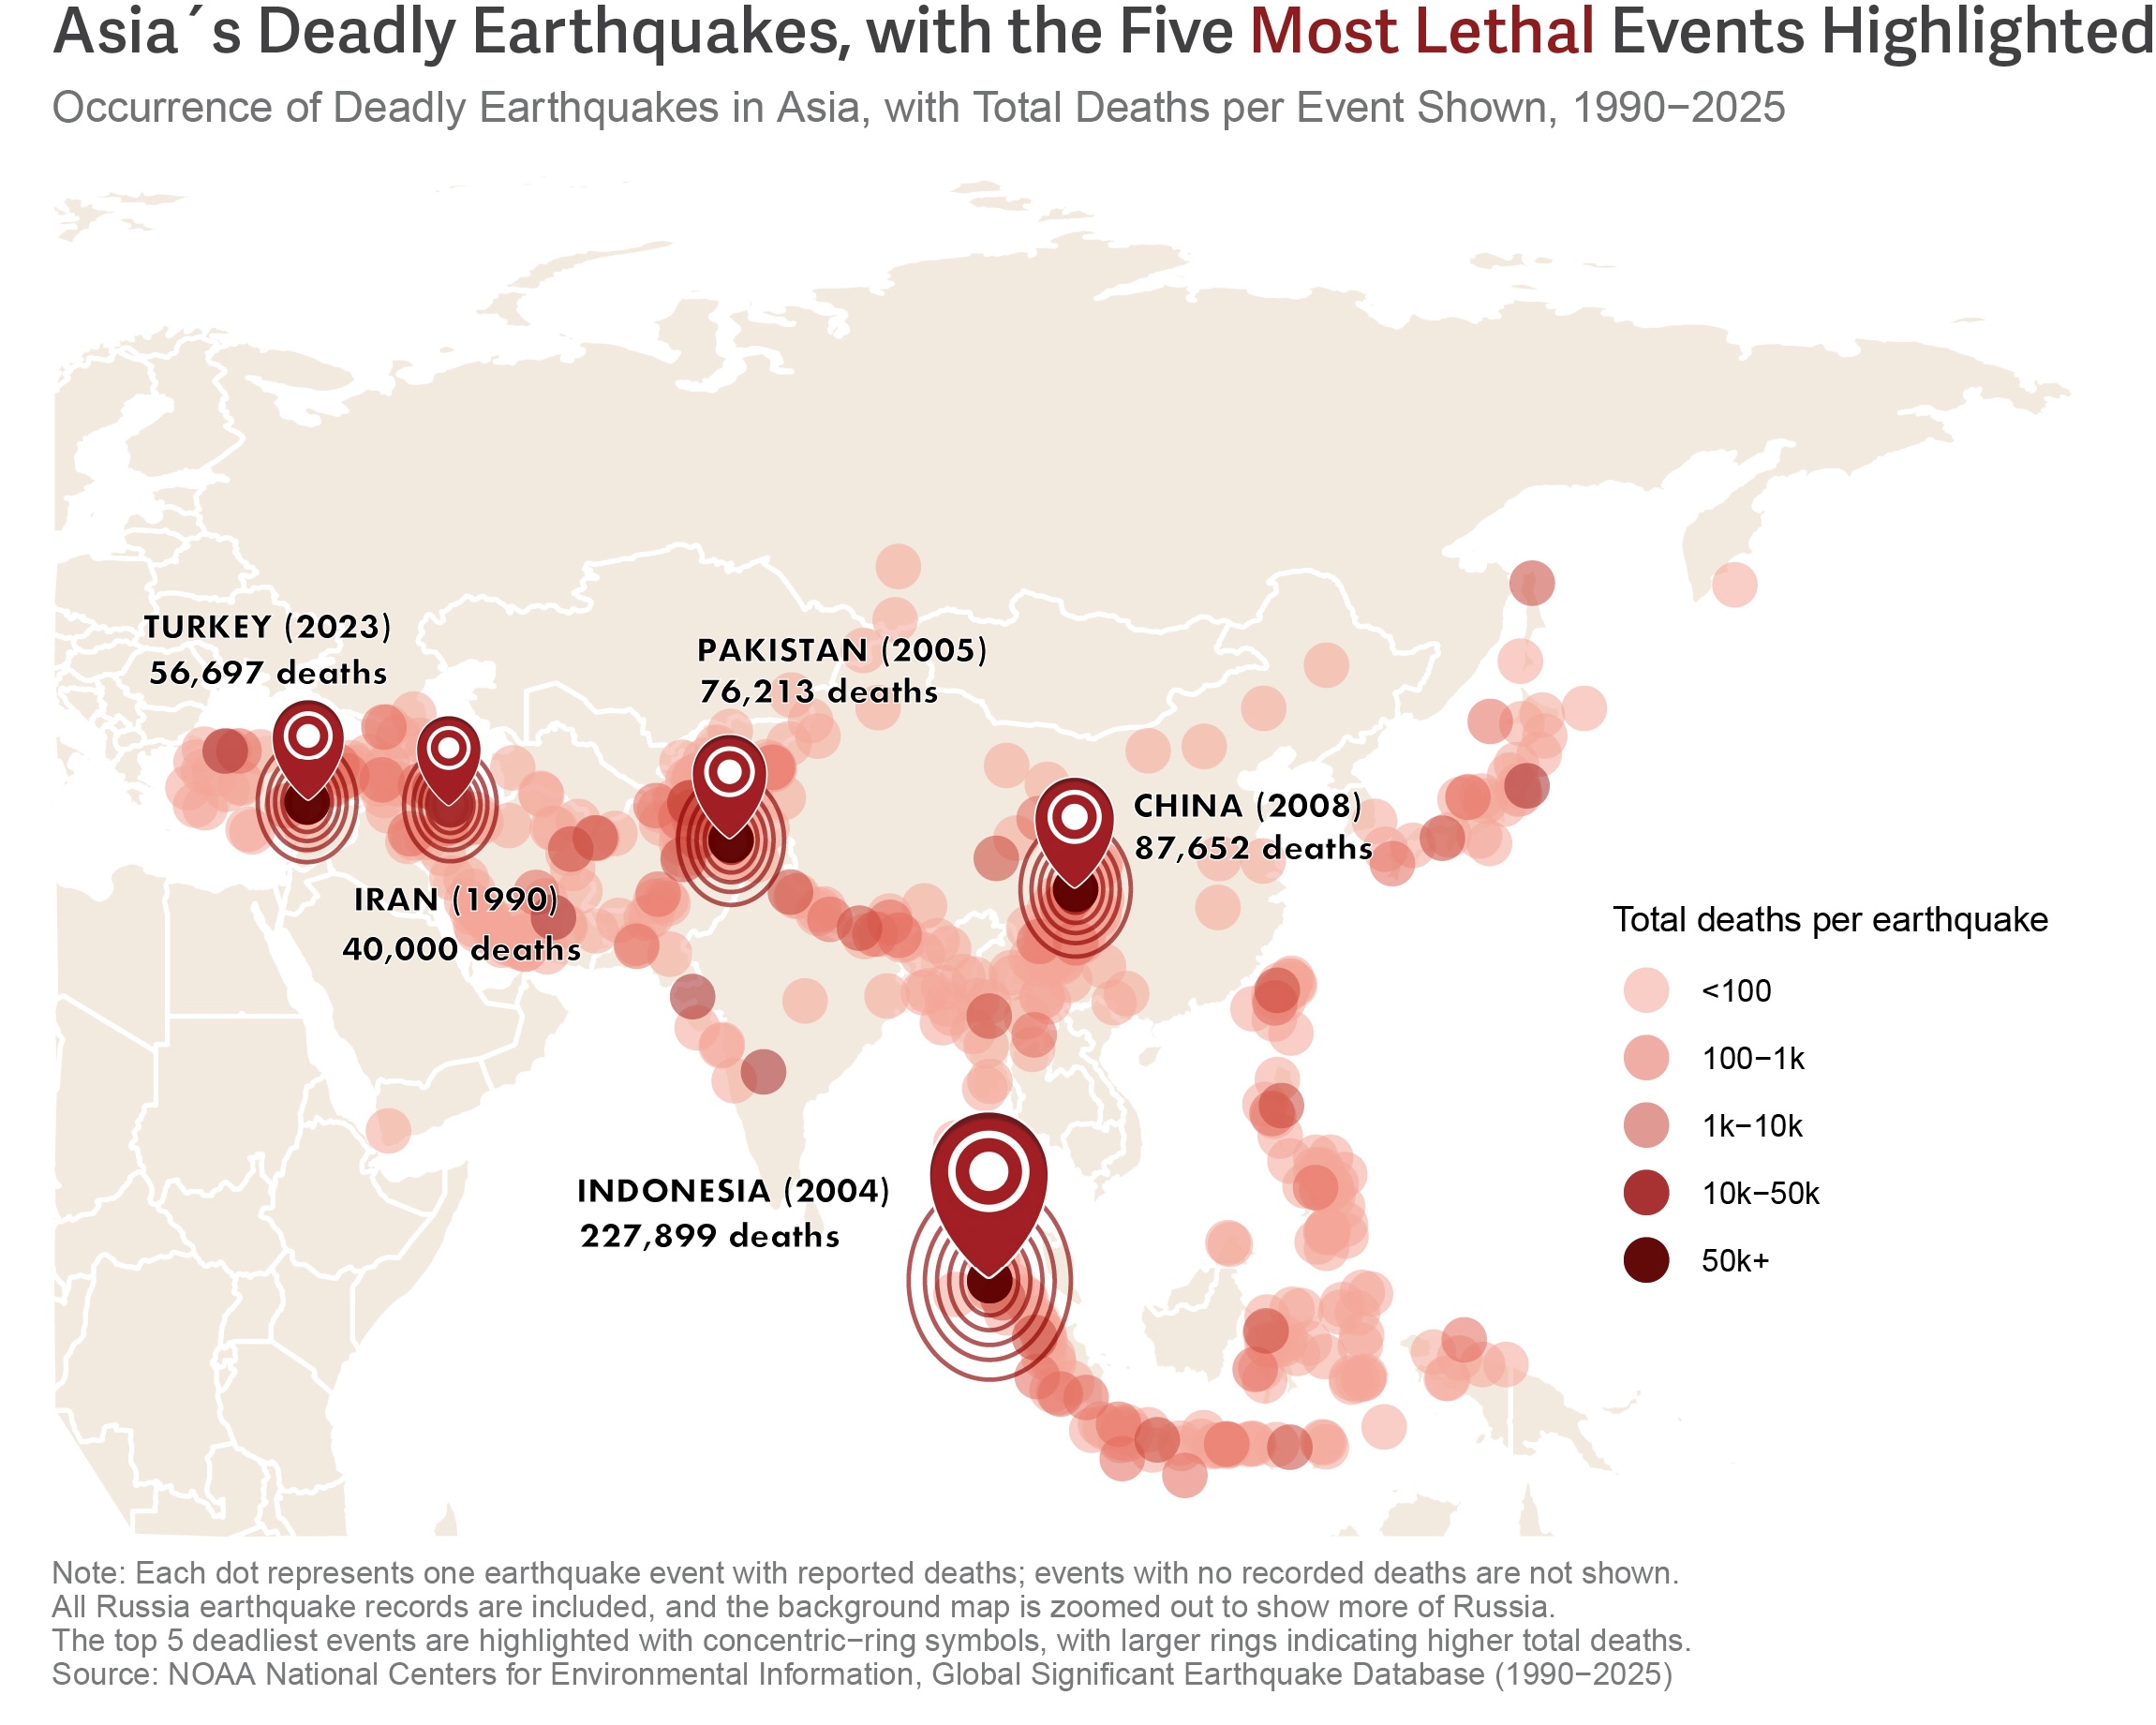
The map shows that the pattern of deadly earthquakes in Asia is far from random. Instead, the disasters form a broad arc stretching from West Asia through South Asia and down through Southeast Asia, following the area’s tectonic seismic boundaries. Clearly, some parts of Asia experienced more seismic activity compared to others. But occurrence alone is not persuasive enough to claim the risk in certain areas. Some areas may have frequent but less deadly events, while other places may struggle with less often but greater disasters, leading to much more human loss. Therefore, the map also shows the total deaths in colors and highlights the top five deadly earthquake across Asia. These five events, with outsized consequences, are located in Indonesia, China, Pakistan, Turkey, and Iran.
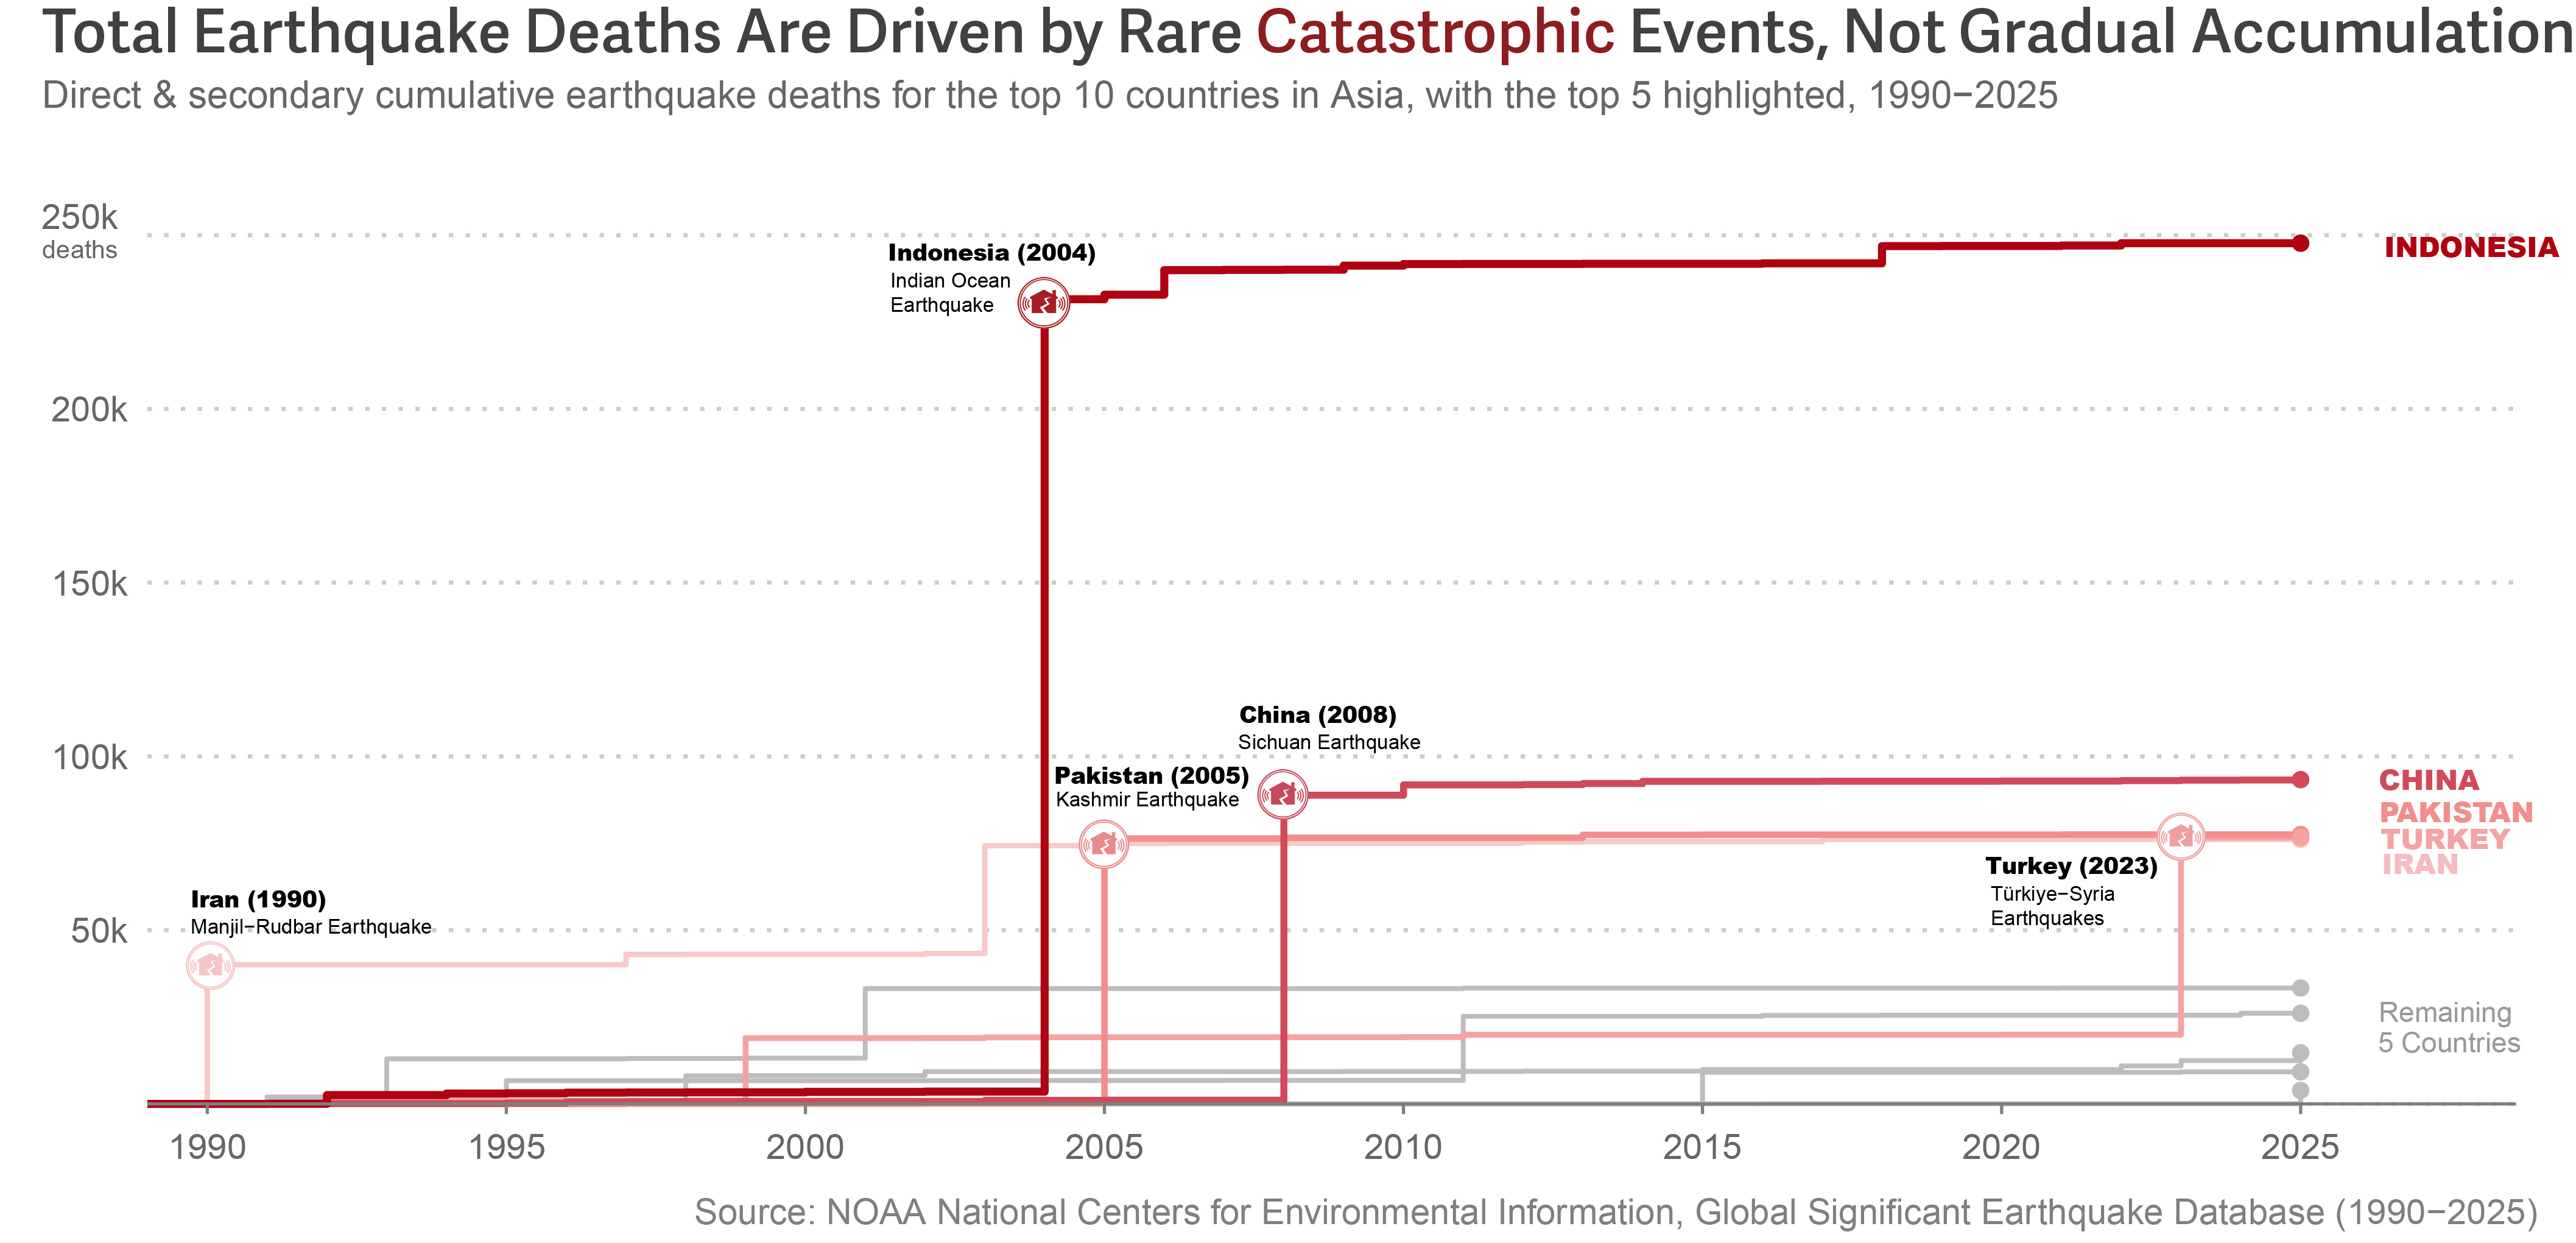
This time series plot shifts from geography to time, showing how earthquake deaths accumulated across the ten deadliest countries in Asia over 35 years. Notice that the lines are not rising steadily as expected. Instead, every line performs a sharp jump at some specific moments, meaning that total death is driven less by gradual accumulation, but by rare catastrophic events. Among all, Indonesia performs the most dramatically, with nearly no deaths for the first 14 years, and a huge jump in 2004. China, Pakistan, Turkey, and Iran also show that a single major disaster can permanently reshape a country’s cumulative toll. This pattern reinforces the broader argument of the project: Asia’s earthquake burden is not only a matter of frequent seismic activity, but also of human vulnerability. For many communities, life may appear stable from one day to the next, yet a single catastrophic earthquake can suddenly turn ordinary routines into a mass tragedy, causing an enormous loss of life in just a matter of hours.
This project was created as a final for DATA 1500 at Brown University, and I am grateful to Professor Reuben Fischer-Baum for his guidance throughout the course. It uses the NOAA Global Significant Earthquake Database, which can be accessed here. I was especially drawn to this dataset because my hometown, Sichuan, China, is a place where earthquakes are a familiar part of life. Through these visualizations, I explore whether Asia truly experiences both the highest number of earthquakes and the greatest human toll, and I examine how physical features such as magnitude and location connect to deaths and broader patterns of regional risk.
National Centers for Environmental Information. (n.d.). Global significant earthquake database: Event data, 1990–2025. NOAA. https://www.ngdc.noaa.gov/hazel/view/hazards/earthquake/event-data?maxYear=2025&minYear=1990
U.S. Geological Survey. (n.d.). What is the “Ring of Fire”? https://www.usgs.gov/faqs/what-ring-fire
Meissner, S. (2021). The nature of fragile things. Berkley.